Question
Using the supplied velocity vs time graph, sketch the corresponding acceleration vs time graph.
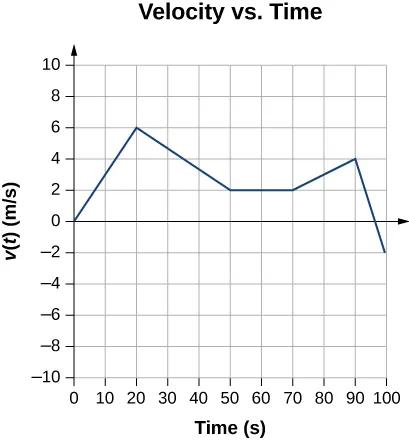
Original graph: OpenStax, University Physics Volume 1, Chapter 3, Problem 39.
| Time (s) | Velocity (m/s) |
|---|---|
| 0 | 0 |
| 20 | 6 |
| 50 | 2 |
| 70 | 2 |
| 90 | 4 |
| 100 | -2 |
The table transcribes the original graph’s vertices; adjacent vertices are joined by straight segments. It adds no new question requirements.
This question has been answered.
Explore the full answer and supporting references to better understand this question.
Verla BasicBest value
$19.99/month
- Everything in Study Pass
- Assignments with writing output
- AI detection and humanizer
- Basic quotas across every tool
Study Pass
$0.99/month
- Entire question library
- Knowledge guides and sources
- Detailed answers and explanations
- No AI tools or quotas
Evidence boundary
The question and original velocity graph are OpenStax University Physics Volume 1, Chapter 3, Problem 39. The answer uses the graph’s five straight segments and exact labeled breakpoints. It supplies interval accelerations and the required sketch; it does not infer unshown motion outside 0–100 s or smooth the corners.