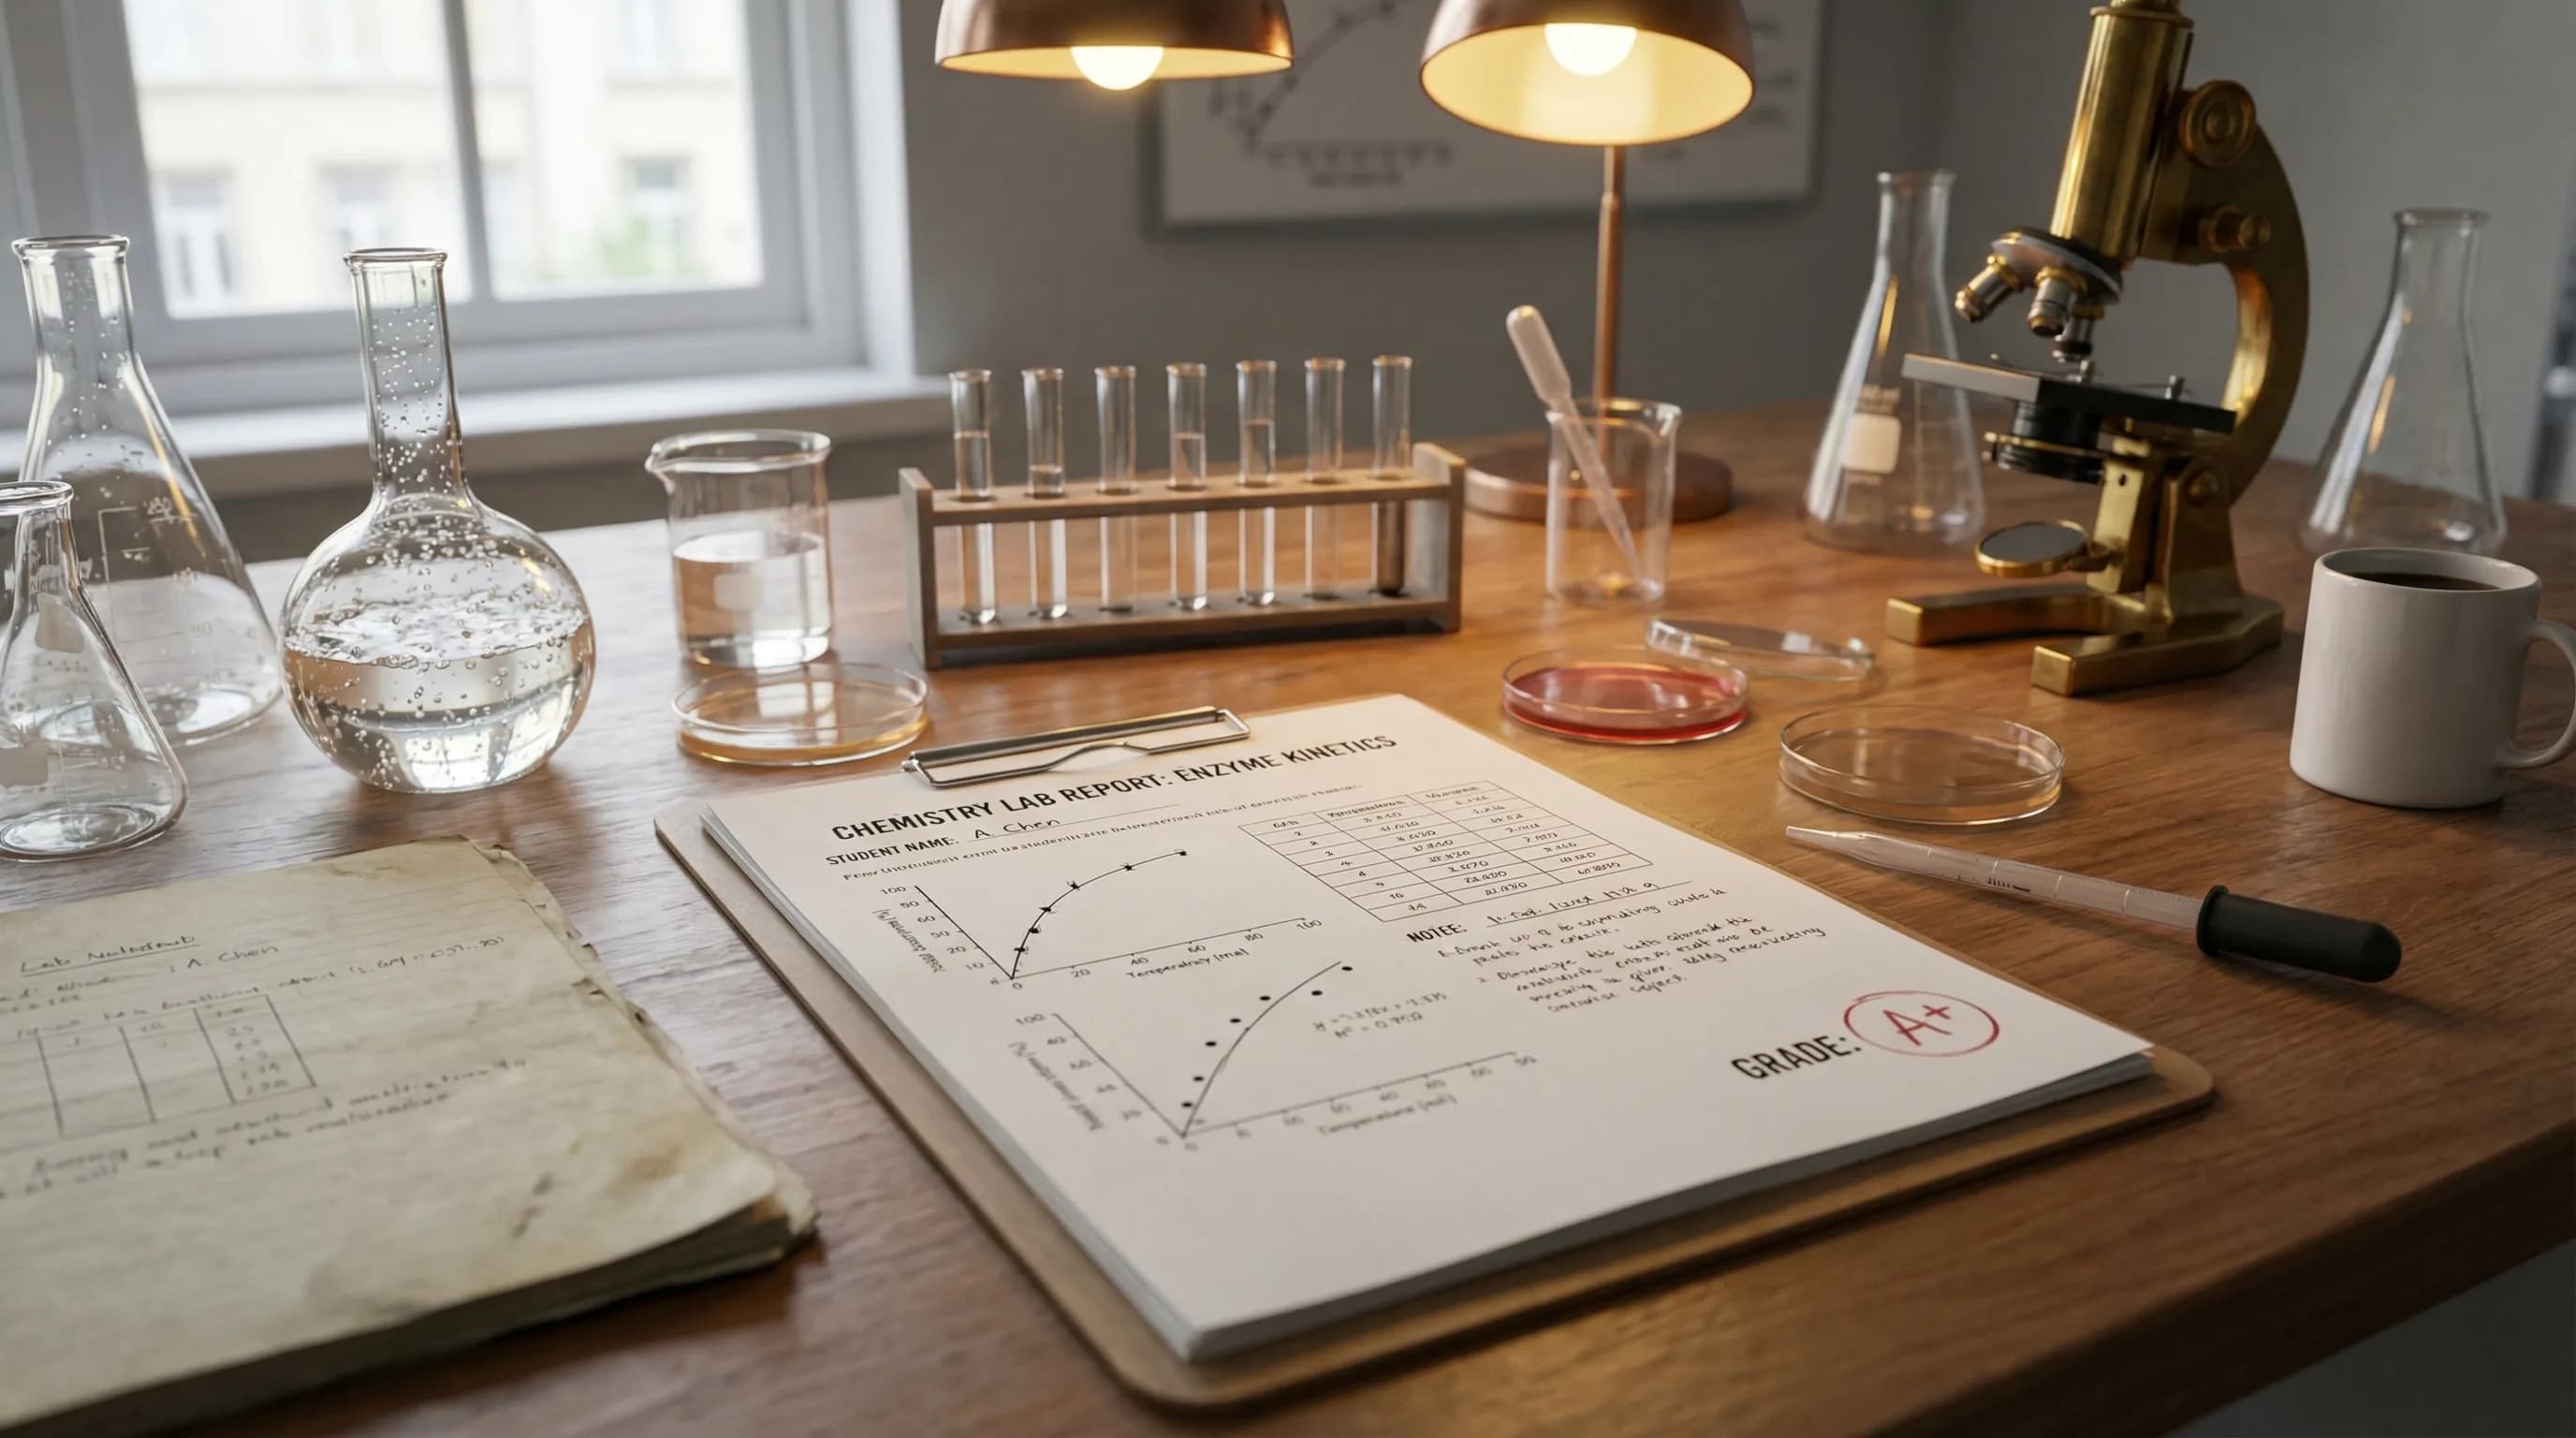
A lab report should show a clear path from the task you completed to the evidence you collected and the conclusion you reached. Whether you are completing an introductory chemistry assignment such as Conversion Factors and Problem Solving (Lab 2) or reporting the results of an experimental investigation, the goal is the same: present your work clearly and support every conclusion with evidence.
This guide explains how to organize raw measurements, create useful tables and figures, separate Results from Discussion, and turn your materials into a structured lab report.
Key Takeaways
- Organize your measurements, calculations, and observations before drafting.
- Use tables for exact values and figures for visible trends or relationships.
- Keep Results and Discussion separate: Results presents the evidence, while Discussion explains its meaning.
- A useful error analysis identifies the problem, its effect on the data, and a realistic improvement.
- Write the Abstract last, after the findings and conclusion are settled.
Lab Report Structure at a Glance
The exact structure may vary between courses. Some reports combine Results and Discussion, while others do not require a separate Abstract or Conclusion.
Step 1: Organize Your Instructions and Data
Before drafting, bring the assignment instructions, lab notes, measurements, calculations, spreadsheets, and reference materials into one place. Identify the research question, variables, hypothesis, required sections, and formatting requirements.
For a temperature and enzyme activity experiment, the starting point might look like this:
Research question: How does temperature affect catalase activity?
Independent variable: Temperature
Dependent variable: Volume of oxygen produced per minute
Hypothesis: Catalase activity will increase as temperature rises, reach its highest level near 37°C, and then decrease at higher temperatures.
If the assignment includes unit conversions, record the original measurements and show how each final value was calculated. The NIST Guide to Unit Conversion is a useful reference for selecting conversion factors and rounding results to an appropriate number of significant digits.
Organizing the evidence first prevents missing values, unsupported claims, and sections that do not match the actual experiment.
Step 2: Turn Raw Data Into Tables and Figures
Use a table when readers need exact measurements. Use a figure when the overall relationship between variables matters more than each individual value.
Table 1. Catalase Activity at Different Temperatures
A line graph would make the pattern easier to recognize: catalase activity increased up to 37°C before falling at 50°C.
A suitable caption would be:
Figure 1. Effect of temperature on catalase activity, measured by oxygen production per minute.
Keep units, decimal places, and significant figures consistent. Every table or figure should be mentioned in the Results, but the caption should not explain why the pattern occurred.
Step 3: Write the Results
The Results section states what the evidence shows without explaining the scientific reason behind it.
Catalase activity increased as the temperature rose from 10°C to 37°C. As shown in Figure 1, oxygen production increased from 2.1 mL/min at 10°C to a maximum of 6.4 mL/min at 37°C. Activity then decreased to 2.7 mL/min at 50°C.
This paragraph identifies the main pattern, includes the most useful values, and refers to the figure.
The following sentence does not belong in Results:
Activity decreased at 50°C because the high temperature disrupted the enzyme's structure.
The word "because" introduces an interpretation, which belongs in the Discussion.
A simple distinction is:
Results: What happened?
Discussion: Why did it happen?
Step 4: Explain the Findings in the Discussion
The Discussion connects the evidence to the original research question. It should explain the meaning of the results, evaluate whether the evidence supports the hypothesis, and show how limitations affect the strength of the conclusion. The University of Toronto's lab report guide describes this as the section where you demonstrate your understanding of the experiment rather than simply reporting what you did.
Catalase activity reached its highest measured rate at 37°C. The increase at lower temperatures may be explained by greater molecular movement, which increased successful collisions between catalase and hydrogen peroxide. The decline at 50°C suggests that high temperature disrupted the enzyme's functional structure. These findings supported the hypothesis, although the exact optimum temperature could not be identified because no measurements were collected between 37°C and 50°C.
A useful limitation identifies the problem, explains its effect, and suggests an improvement:
The water bath temperature fluctuated during several trials, which may have increased variation between measurements. A digitally controlled water bath would provide more stable conditions in future experiments.
This is stronger than saying only that "human error affected the results" because it explains exactly how the reliability of the evidence was weakened.
Step 5: Complete the Remaining Sections
Once the Results and Discussion are clear, the other sections are easier to write.
The Methods section should describe what was actually done with enough detail for another student to understand the procedure:
Catalase samples were placed in water baths at five temperatures. Hydrogen peroxide was added, and the volume of oxygen produced over 60 seconds was recorded.
The Introduction should move from the scientific background to the specific research question and hypothesis:
Catalase is an enzyme that breaks down hydrogen peroxide into water and oxygen. This experiment investigated how temperatures between 10°C and 50°C affected catalase activity. It was hypothesized that activity would peak near 37°C before declining at higher temperatures.
The Conclusion should answer the research question directly without introducing new evidence:
Catalase activity increased between 10°C and 37°C before decreasing at 50°C, supporting the conclusion that excessive heat reduces catalase function.
Write the Abstract last. It should briefly summarize the purpose, method, main result, and conclusion using information that already appears in the completed report.
How Verla Fits the Lab Report Workflow
A lab report often begins with information scattered across assignment PDFs, spreadsheets, lecture materials, and handwritten observations. Verla's Lab Report Generator brings these materials into one workflow and turns them into a structured starting point.
Upload the Actual Experiment Materials
Start by uploading the assignment instructions, lab notes, raw data, spreadsheets, supporting sources, and formatting requirements. Providing the original materials gives Verla enough context to understand the experiment, expected sections, and evidence available.
This produces a more useful result than entering only a broad topic such as "write a chemistry lab report."
Build the Report Around Your Evidence
Verla can organize the uploaded information into a report structure containing the Introduction, Methods, Results, Discussion, Conclusion, and References. It can also help identify the main data trends and arrange measurements into clearer tables or figures.
Instead of working from a blank page, you begin with a draft built around the materials you already collected.
Verify the Results and Strengthen the Discussion
The generated draft should always be compared with the original experiment. Check every value, unit, calculation, caption, and scientific explanation before continuing.
Once the evidence is accurate, use the AI Essay Advisor to review whether the report moves logically from data to interpretation. It can help identify places where the Discussion repeats the Results, where an explanation lacks evidence, or where the Conclusion goes beyond what the experiment supports.
Refine the Final Draft
After the scientific content is correct, the AI Humanizer can reduce repetitive, mechanical, or awkward wording while preserving the technical meaning of the report. Review the revised version beside the original to make sure terminology, values, and conclusions remain accurate.
You can also use AI Detection to locate passages that may need more manual revision. Detection results should be treated as editing signals rather than definitive proof of how a passage was written.
Upload the materials → Generate the structure → Verify the data → Strengthen the reasoning → Refine the writing
Verla handles much of the organization and initial drafting, while the student remains responsible for the accuracy of the evidence and the final scientific argument.
Common Lab Report Mistakes
Mixing Results With Discussion
The Results should describe what the data shows. Explanations about why the pattern occurred belong in the Discussion.
Adding a Table or Figure Without Explaining It
Every table and figure should be mentioned in the surrounding text. Direct the reader to the most important values or trends instead of expecting the visual to explain itself.
Repeating the Results in the Discussion
The Discussion should interpret the evidence, not present the same measurements again in slightly different words.
Using "Human Error" Without Detail
Identify the specific problem, explain how it affected the measurements, and suggest a realistic improvement.
Writing the Abstract Too Early
The Abstract summarizes the completed report, so write it after the Results, Discussion, and Conclusion are settled.
Trusting AI-Generated Content Without Checking It
Verify every generated value, calculation, citation, and scientific explanation against the original assignment materials and raw data.
The Bottom Line
A strong lab report connects the research question, evidence, interpretation, and conclusion without leaving gaps.
Organize the experiment materials first, present the data clearly, keep Results separate from Discussion, and explain how specific limitations affected the findings. Verla can speed up the process by turning scattered materials into a structured report draft, but the final submission should always remain grounded in verified data and the student's own scientific reasoning.