Question
The position of an object is x(t) = 5t m, with t measured in seconds. (a) Find its velocity function. (b) Draw both the position-versus-time and velocity-versus-time graphs.
(a) Velocity function
Read the given position law dimensionally as x(t) = (5 m/s)t, where t is in seconds. Differentiate position with respect to time:
The motion has constant positive velocity. Its acceleration is zero.
(b) Both requested graphs
The position-versus-time graph is a straight line through (0 s, 0 m), with slope 5 m/s. The velocity-versus-time graph is a horizontal line at 5 m/s, not a line rising from zero.
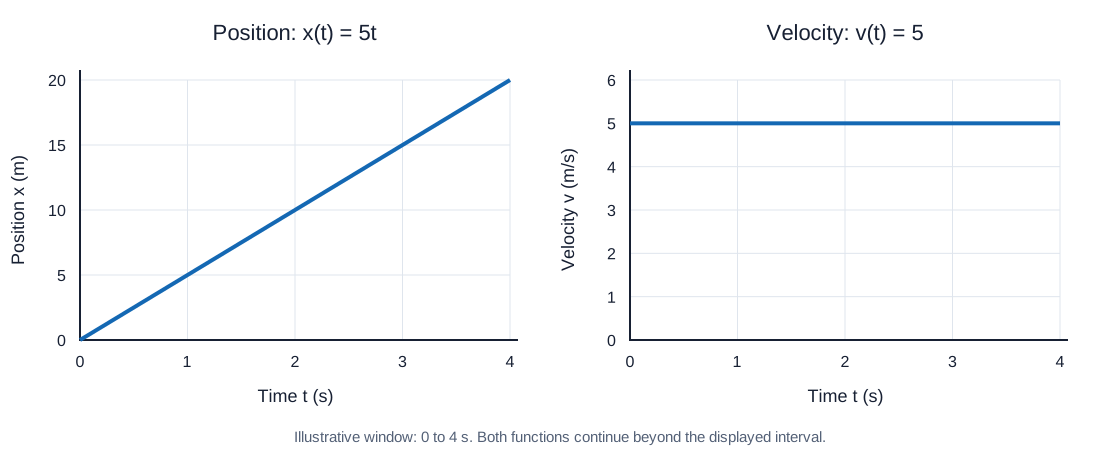
| Time t (s) | Position x (m) | Velocity v (m/s) |
|---|---|---|
| 0 | 0 | 5 |
| 1 | 5 | 5 |
| 2 | 10 | 5 |
| 3 | 15 | 5 |
| 4 | 20 | 5 |
These points determine both straight lines. Label the horizontal axes time in seconds and use separate vertical axes: position in metres and velocity in metres per second. The displayed 0–4 s interval is chosen for illustration because the problem gives no time interval. The functions continue wherever the position law applies.
As a consistency check, the position graph's slope is (20 − 0)/(4 − 0) = 5 m/s, and the area under the velocity graph over the displayed interval is (5 m/s)(4 s) = 20 m, matching the displacement.
Evidence boundary
This solution follows OpenStax University Physics Volume 1, Chapter 3, Problem 34, including both graphing tasks. The plots are generated from the given function, not measured data or an official answer image. The 0–4 s display interval is illustrative; no time interval is specified in the original problem.
Sources
Các nguồn này hỗ trợ những khái niệm và phương pháp được giải thích ở trên.