Question
Using the supplied position vs time graph, sketch the corresponding velocity vs time graph.
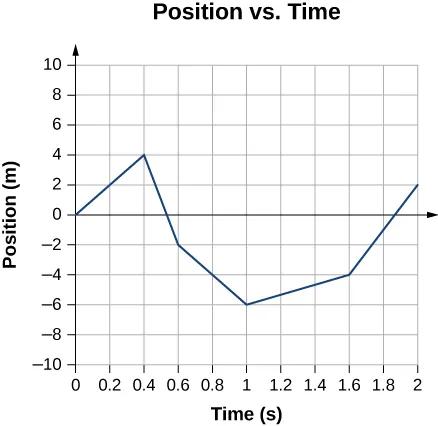
Original graph: OpenStax, University Physics Volume 1, Chapter 3, Problem 31.
| Time (s) | Position (m) |
|---|---|
| 0 | 0 |
| 0.4 | 4 |
| 0.6 | -2 |
| 1 | -6 |
| 1.6 | -4 |
| 2 | 2 |
The table transcribes the original graph’s vertices; adjacent vertices are joined by straight segments. It adds no new question requirements.
Convert each position slope into velocity
The original graph consists of straight segments. Within each segment,
| Time interval (s) | Position change (m) | Slope calculation | Velocity (m/s) |
|---|---|---|---|
Required velocity vs time sketch
Draw five horizontal segments at the velocities in the table, over exactly the listed intervals. Use time in seconds on the horizontal axis and velocity in m/s on the vertical axis. Keep the segments separate at the slope changes.
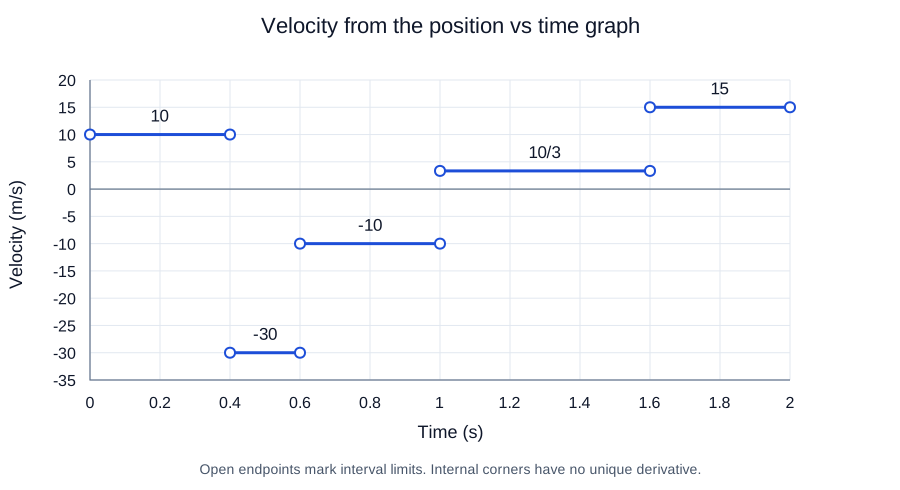
The graph shows movement in the positive direction, then the negative direction for two segments, then the positive direction for two segments. Being at a negative position does not require a negative velocity: from to , position is negative but increasing.
Corners and consistency check
At , the left and right slopes differ, so the ideal piecewise-linear position graph has no unique instantaneous velocity there. Open endpoints mark those transitions; they do not describe a finite-time vertical motion in the velocity graph. At the overall endpoints, only one-sided slopes are supplied.
The signed velocity areas total , matching the final position minus the initial position.
Evidence boundary
The question and original position graph are OpenStax University Physics Volume 1, Chapter 3, Problem 31. The calculation uses the five straight segments and labeled coordinates in that graph, not experimental measurements. The answer sketch treats slope changes as instantaneous ideal corners, where a unique velocity is not defined.
Sources
Các nguồn này hỗ trợ những khái niệm và phương pháp được giải thích ở trên.