Question
In a perfectly competitive market, quantity demanded is and quantity supplied is .
- Calculate the equilibrium price and quantity and plot the equilibrium.
- A price ceiling fixes the maximum permitted price at . Calculate demand and supply at that price.
- Determine how many units are traded and quantify any shortage or surplus. On a supply-and-demand graph, mark the controlled price, traded quantity, and shortage or surplus.
1. Equilibrium price and quantity
Set demand equal to supply:
At that price, and . The competitive equilibrium is .
For the graph, put quantity on the horizontal axis and price on the vertical axis. The inverse demand curve is ; inverse supply is . They intersect at . Draw the economically relevant supply segment from upward, rather than interpreting its negative-price extension as actual supply.
2. Demand and supply under the price ceiling
The maximum legal price is , below the equilibrium price of 10, so the ceiling is binding.
Buyers want 84 units, while sellers supply 74 units.
3. Quantity exchanged, shortage, and the controlled-price graph
In the standard competitive-market model, transactions cannot exceed the smaller of demand and supply. At the controlled price, sellers supply the smaller quantity:
74 units are exchanged, with a shortage of 10 units. There is no surplus.
| Outcome | Price | Quantity demanded | Quantity supplied | Quantity exchanged | Shortage |
|---|---|---|---|---|---|
| Competitive equilibrium | 10 | 80 | 80 | 80 | 0 |
| Binding ceiling | 8 | 84 | 74 | 74 | 10 |
Graphs for parts 1 and 3
The equilibrium panel marks . The ceiling panel adds the horizontal line , the supply intersection and demand intersection . The horizontal gap between 74 and 84 is the 10-unit shortage; the traded quantity is 74, not 84.
The plotted curves can be reconstructed from these points:
| Curve | First point | Second point |
|---|---|---|
| Demand | ||
| Supply, nonnegative-price segment |
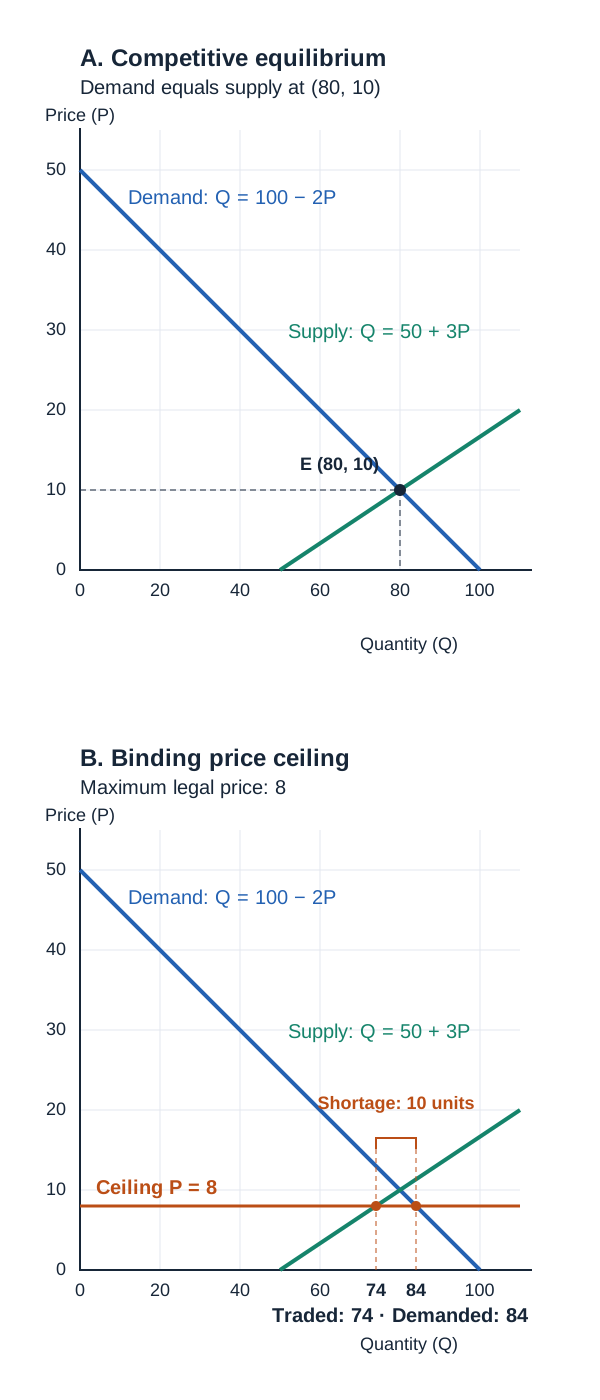
The cap prevents price from rising to the market-clearing value. It changes quantities demanded and supplied along the given curves; it does not by itself shift either curve.
Evidence boundary
This is a standardized restatement and worked solution of University of Puget Sound ECON 102, §6.5.1 problem 6, including all three parts and both graph requirements. All numerical results follow from the supplied curves. Quantity traded equals the short side of the market under the usual model assumptions: an enforced ceiling, unchanged curves, and no additional intervention. No observed real-market outcome or allocation among buyers is supplied.
Sources
Các nguồn này hỗ trợ những khái niệm và phương pháp được giải thích ở trên.