Question
Look at the following energy diagram for an enzyme-catalyzed reaction:
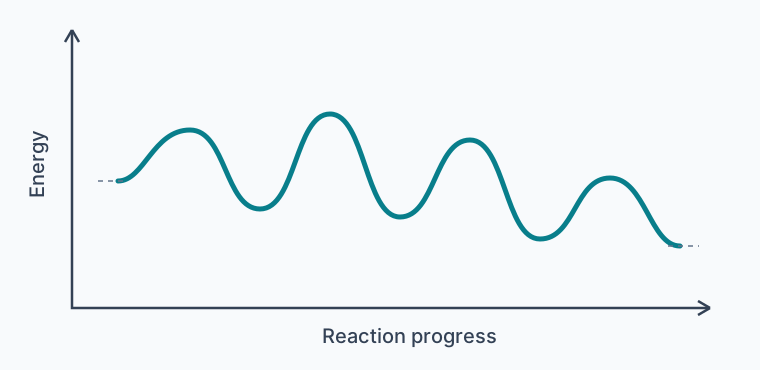
(a) How many steps are involved?
(b) Which step is most exergonic?
(c) Which step is slowest?
(a) Number of steps
Four steps. Each of the four peaks represents a transition state for one step; the three valleys between peaks represent intermediates.
(b) Most exergonic step
Step 1, counting from left to right. Its starting energy level to the next valley shows the largest downward change among the four steps.
(c) Slowest step
Step 2. The rise from the first intermediate valley to the second peak is the largest forward activation barrier. Compare each peak with its immediately preceding valley rather than comparing peak heights from the page baseline.
Evidence boundary
The answer reads only the relative levels in the supplied qualitative profile, with steps numbered left to right. The diagram gives no numerical activation energies or free-energy changes. The visible vector profile redraw preserves the official figure’s qualitative ordering without copying its image.
Sources
Các nguồn này hỗ trợ những khái niệm và phương pháp được giải thích ở trên.