Question
Using the supplied velocity vs time graph, sketch the corresponding acceleration vs time graph.
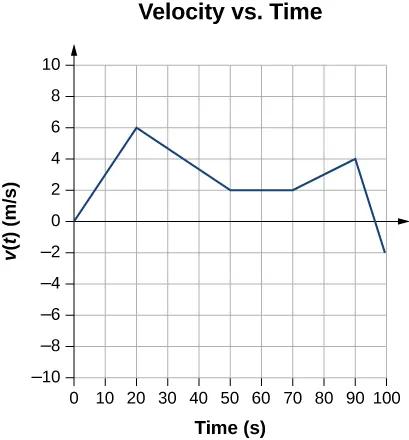
Original graph: OpenStax, University Physics Volume 1, Chapter 3, Problem 39.
| Time (s) | Velocity (m/s) |
|---|---|
| 0 | 0 |
| 20 | 6 |
| 50 | 2 |
| 70 | 2 |
| 90 | 4 |
| 100 | -2 |
The table transcribes the original graph’s vertices; adjacent vertices are joined by straight segments. It adds no new question requirements.
Find acceleration from the velocity slopes
For each straight segment, use
| Time interval (s) | Velocity change (m/s) | Slope calculation | Acceleration (m/s²) |
|---|---|---|---|
Required acceleration vs time sketch
Draw five horizontal segments at these accelerations over the matching time intervals. Label the axes time in seconds and acceleration in m/s².
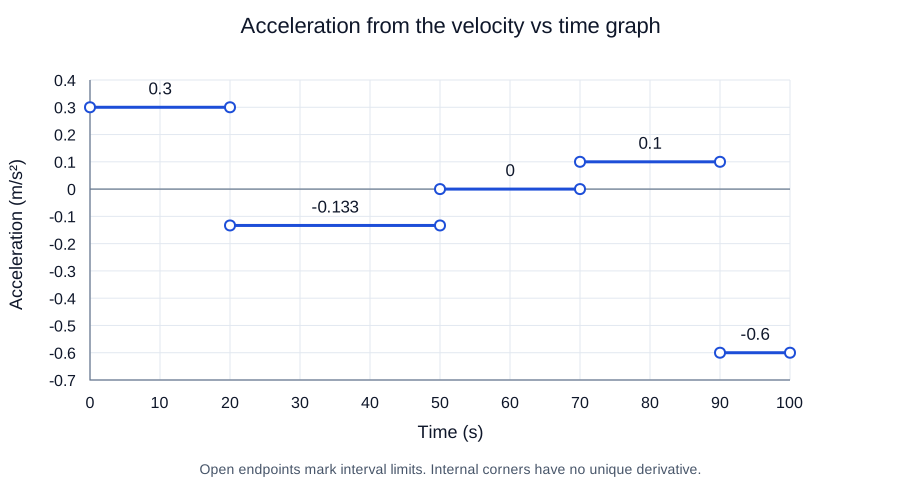
The – interval has zero acceleration, although the object is moving at . Negative acceleration on – reduces the positive velocity. On the last segment the same negative acceleration first reduces positive speed, then increases speed in the negative direction after velocity crosses zero at .
Transitions and consistency check
At , acceleration is undefined in the ideal graph because the velocity slope changes abruptly. Open endpoints show the separate interval values without inventing a transition duration. The overall endpoints provide only one-sided slopes.
The acceleration areas give a velocity change of , equal to .
Evidence boundary
The question and original velocity graph are OpenStax University Physics Volume 1, Chapter 3, Problem 39. The answer uses the graph’s five straight segments and exact labeled breakpoints. It supplies interval accelerations and the required sketch; it does not infer unshown motion outside 0–100 s or smooth the corners.
Sources
Эти источники подтверждают изложенные выше концепции и методы.