Question
For the butadiene dimerization reaction 2 C₄H₆(g) → C₈H₁₂(g), prepare and compare two suitable plots of the data below to decide between first-order and second-order kinetics. Then estimate the rate constant.
| Time (s) | [C₄H₆] (mol/L) |
|---|---|
| 0 | 1.00 × 10⁻² |
| 1600 | 5.04 × 10⁻³ |
| 3200 | 3.37 × 10⁻³ |
| 4800 | 2.53 × 10⁻³ |
| 6200 | 2.08 × 10⁻³ |
Prepare the two plots
For first-order kinetics, plot against time. For second-order disappearance kinetics, plot against time. Here is butadiene.
| Time (s) | ln([A]/1 M) | 1/[A] (M⁻¹) |
|---|---|---|
| 0 | −4.60517 | 100.000 |
| 1600 | −5.29035 | 198.413 |
| 3200 | −5.69284 | 296.736 |
| 4800 | −5.97954 | 395.257 |
| 6200 | −6.17539 | 480.769 |
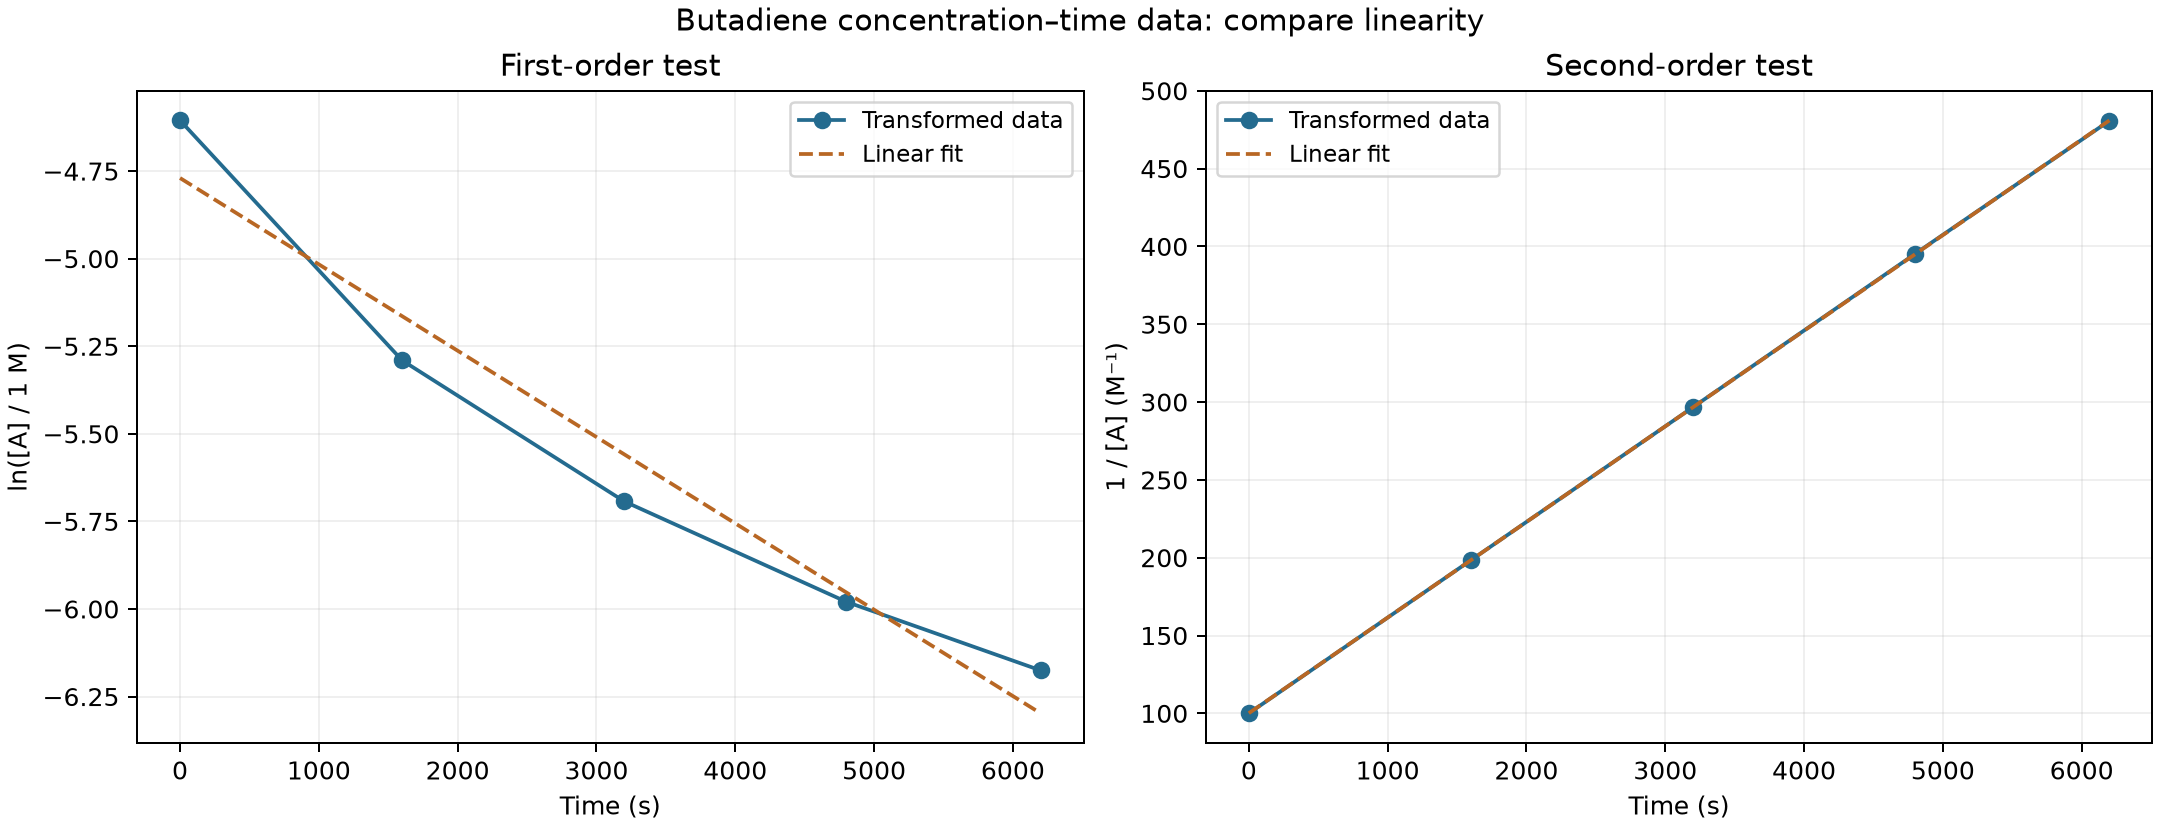
The logarithmic plot curves. Its successive segment slopes are approximately −0.000428, −0.000252, −0.000179, and −0.000140 s⁻¹. The reciprocal plot has nearly constant segment slopes around 0.0611–0.0616 M⁻¹ s⁻¹. Thus the supplied data support second-order disappearance kinetics.
Estimate the rate constant
Using the endpoints of the reciprocal plot:
The corresponding integrated law is . A least-squares line through all reciprocal points gives slope 0.061437 M⁻¹ s⁻¹ and intercept 100.095 M⁻¹, consistent with the endpoint estimate.
Rate convention
This belongs to , the disappearance convention used by the section’s integrated law. If reaction rate is instead defined as for , the constant in is L mol⁻¹ s⁻¹.
Evidence boundary
The complete concentration–time dataset and first-versus-second-order request come from OpenStax Example 12.9. The plots are newly drawn from those tabulated data, not copied textbook graphics. The constant is estimated from rounded data and follows the disappearance-rate convention of the integrated law; no new experimental measurements are asserted.
Sources
Эти источники подтверждают изложенные выше концепции и методы.