Question
Solve the following inequality using a graphing utility:
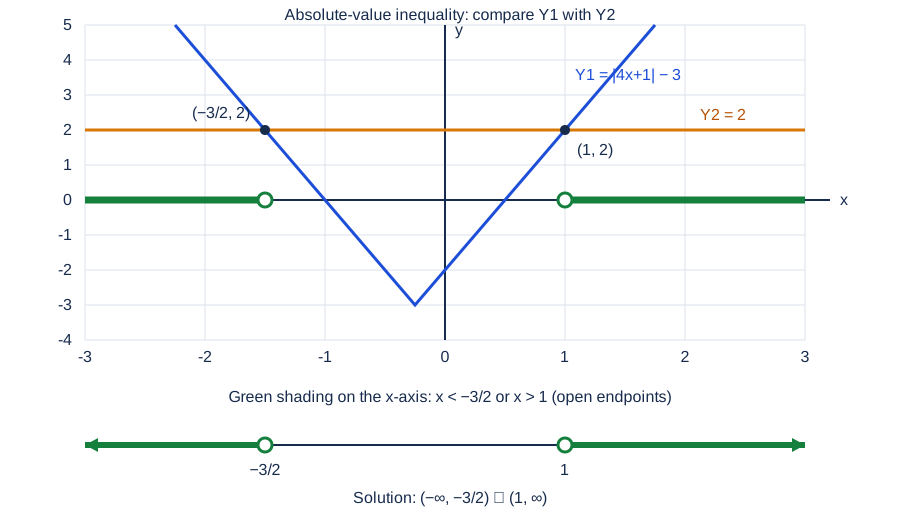
Enter and . Use the absolute-value command (MATH → Num → 1:abs on the textbook's calculator) and locate the intersections (2nd → CALC → 5:intersection; select the first curve, second curve, and a guess). Provide a sketch of both graphs, shade the solution on the x-axis, and give the final solution in interval notation.
Complete graphical and algebraic solution
The solution is
1. Enter and sketch the two graphs
In the graphing utility enter and . The first graph is a V with vertex ; the second is a horizontal line at height .
To reproduce the sketch, use a window such as and . The two branches of the V are
2. Find the intersections
Set the two outputs equal:
The two equations and give and . Thus the intersections are
Use the calculator's intersection command near each point to check them. These are analytically verified coordinates, not claimed screenshots of a student's calculator session.
3. Shade where the V lies above the line
The inequality is strict, so select the portions where , outside the two intersection x-values. The sketch includes the required shading on the x-axis; open circles exclude the boundary values. The additional number line makes the two rays explicit.
4. Express and verify the interval solution
Algebra gives the same two rays:
| Test x | Comparison with | Include? | |
|---|---|---|---|
| Yes | |||
| No | |||
| Yes |
At both boundary x-values the output is exactly , so neither endpoint belongs to the solution. Infinity always uses a parenthesis.
Evidence boundary
This is the complete graphing-utility task in OpenStax College Algebra section 2.7, exercise 56. The supplied sketch is generated from the exact piecewise equations and verified intersections, with the required x-axis shading. It is a mathematical solution, not a fabricated record of a particular calculator session.
Sources
Эти источники подтверждают изложенные выше концепции и методы.